1. Guards
38%
2. Old patients
51%
3. Others
11%
|
PROBLEM SOLVING THROUGH SYSTEMS APPROACH - HIS A CORE ELEMENT |
|
|
Dr. Hem Chandra |
|
|
Guest Lecture |
|
|
Abstract : |
|
|
Administrator requires information regarding hospital activities on every day, weekly, fortnightly, monthly, yearly basis. Hospital information collected on yearly basis is usually useful for long term planning. The every day information collected by the administrator is more useful in problem solving by strategic management. Once the problem is solved, we have to develop a system approach, which requires continuous monitoring & control to avoid any deviation and occurrence of same or similar problem is future. Activity status (data) received on regular basis, which can be interpreted into meaningful way, is the information. It is of paramount importance for the administrator that the desired information is received timely, accurately adequately through a proper channel and the system. Sanjay Gandhi PGIMS (SGPGIMS), Lucknow solved many day-to-day problems, which arose due to non-formation of system /procedure with the help of everyday information received from the periphery. Among the many, the common problems are non-availability of case sheet for indoor patient, excessive bed movement with in the hospital, misuse of emergency x-ray services and the dead body disposal. Now these systems are running well but are still monitored regularly every day through hospital information system, specially designed to meet certain important patient interests, which may be sensitive and require immediate attention also. |
|
|
Introduction : |
|
|
Problems are the part of the modern superspeciality and complex structured hospital but there are solutions also at the same time. These problems in fact creates hindrance in the day-to-day functioning of the hospitals. If observed keenly, it is easy to identify and find out the ways & means to solve these problems provided that management techniques are used to make the systems for these functioning. Identifying and analyzing the problems is the gate way towards the solution. Modern problem solving process based on work-study of the situation is the key to approach systematically toward the solution. HIS is core element as without information, no decision can be taken. The unit of the information is the data collected by work-study, which needs processing carefully, and meaningfully to result information. |
|
|
Sanjay Gandhi Post Graduate Institute of Medical Sciences, Lucknow is a 640-bedded superspeciality hospital running with computerized and manual HIS system. The administration faced many problem and formed the systems approach with the help of HIS. This paper contains the brief of only three problems, which were solved by the work study basically conducted with following objectives. |
|
|
Problem faced and solved :
|
|
|
Objectives :
|
|
|
Methodology :
|
|
|
Problem No.: 1 |
|
|
Under utilization of Rogi Vishramalaya - (total bed = 96) |
|
|
The Institute has been observing very low occupancy of Rogi Vishramalaya for the last one year (approximately 49%) which was very less in comparison to space compliment and running (recurring) expenditure of the Rogi Vishramalaya. Though this facility was not created to earn revenue but basically to facilitate the OPD patients and their relatives coming from far of places. The utilization of the facility also has distinct effect on OPD crowd. The Institute earns approx. 30% of its non plan annual budget. Therefore if in case by increasing the utilization of Rogi Vishramalaya, the revenue is generated without increasing the charges of the Rogi Vishramalaya, the Institute had no problem. |
|
|
Prestrategy findings - July 2000 to April 2001 |
|
|
Month (2000-2001) |
Occupancy(%) |
Revenue Generated (Rs.) |
|
July |
36 |
8550 |
|
August |
42 |
9970 |
|
September |
41 |
9760 |
|
October |
33 |
7980 |
|
November |
32 |
7630 |
|
December |
32 |
7630 |
|
January |
31 |
7210 |
|
February |
27 |
6130 |
|
March |
29 |
7090 |
|
April |
31 |
7230 |
|
Average |
33 |
7918 |
|
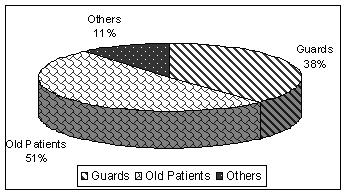
Reasons for under utilization -
|
|
Limiting factor - Source of information Following were the sources from where patients/relatives received the information about Rogi Vishramalaya |
|
1. Guards |
38% |
|
2. Old patients |
51% |
|
3. Others |
11% |
|
|
|
|
Strategy - To focus on guards - Reallocation of guards for dissemination of information about Rogi Vishramalaya |
|
Action plan :
|
|
Post strategy finding - May 2001 - September 2001 (Total bed - 96) |
|
Month |
Occupancy (%) |
Revenue Generated (Rs) |
|
May 2001 |
89 |
19620 |
|
June 2001 |
65 |
15590 |
|
July 2001 |
73 |
17510 |
|
August 2001 |
60 |
14330 |
|
September 2001 |
60 |
14330 |
|
We can conclude that the problem solving exercise undertaken by hospital administration was very successful as it pinpointing come out with the deficiencies in the management and running of Rogi Vishramalaya. It brought out the major factor for under utilization/revenue less viz non-information to patients/attendants about the existence of Rogi Vishramalaya and moreover it suggested steps how to propagate increase in utilization. When the steps were implemented fruitful results were delivered resulting in: -
|
|||||||
|
Achievement : |
|
||||||
|
- Pre strategy occupancy = 33% |
|
||||||
|
- Post strategy occupancy = 70% |
|
||||||
|
Problem No.: 2 Non-availability of case sheet for indoor patient. |
|||||||
|
THE PROBLEM The institute (hospital) has been observing that during the past 6 months that case sheets for a number of patients admitted in the wards were not available on the 1st day of admission, also there were certain cases were the case sheets were not available even after 3-4 days of admission. The senior residents/consultants/nurses often complained about the non-availability of the case sheets, as it would cause delay in starting the treatment. Efforts were made and OPD was analyzed for generation of case sheets. It was found that case sheets of the patients admitted through OPD were sent to their respective ward within 2 hours. However, the problem continued to persist even then. In view to decode the problem and analyze the situation, the hospital administration decided to go for a work-study with the following aim and objectives. |
|||||||
|
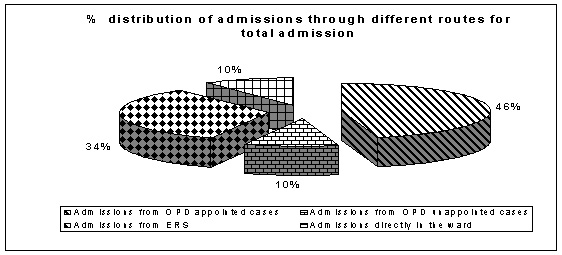
Admission routes : following were the routes through which admission were made |
|||||||
|
|||||||
|
Analysis of the magnitude :- Prospective study between 3-7 and 10-14 June 2003 was carried out to find out the total admission and the missing case sheet |
|||||||
|
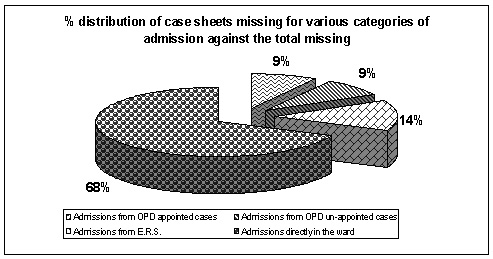
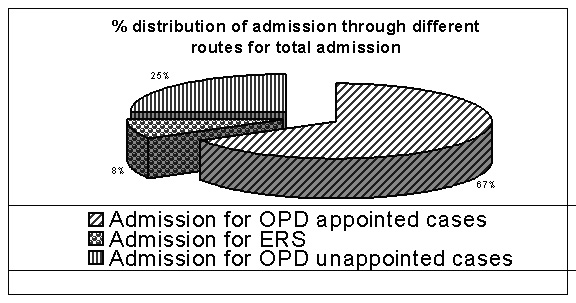
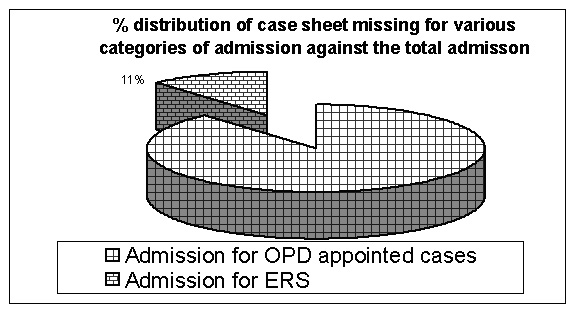
Distribution of type of admission & missing case sheets - 3-7 and 10-14 June 2002 |
|||||||
|
Category Admission |
Type of Admission |
No. of Admission |
Case Sheets Missing No. |
% missing for total adm. |
% missing for type of Admission |
|
1 |
Admissions from OPD appointed cases |
155 |
3 |
0.89 |
1.93 |
|
2 |
Admissions from OPD un-appointed cases |
34 |
3 |
0.89 |
8.82 |
|
3 |
Admissions from E.R.S. |
113 |
5 |
1.48 |
4.42 |
|
4 |
Admissions directly in the ward |
34 |
24 |
7.14 |
70.58 |
|
|
Total |
336 |
35 |
10.41 |
- |
|
|
||||||||||||||||||||||||||||||||||||
|
|
||||||||||||||||||||||||||||||||||||
|
Limiting factor - Admission directly in the ward is the main limiting factor and responsible for the missing of the case sheet (68.9%). |
||||||||||||||||||||||||||||||||||||
|
STRATEGY EVOLVED TO SOLVE THE PROBLEM : The strategy evolved to minimize the missing case sheets was based on the fact that
|
||||||||||||||||||||||||||||||||||||
|
Every situation was analyzed for its feasibility to avoid any confusion and minimize the missing case sheet. Situational analysis revealed the followings. |
||||||||||||||||||||||||||||||||||||
it has to be accepted. Moreover % missing file was the minimum. Therefore effort to improve the condition was ignored inview to take corrective action against the category no. 4 first. |
||||||||||||||||||||||||||||||||||||
|
CORRECTIVE MEASURES : Steps
|
||||||||||||||||||||||||||||||||||||
|
Post strategy findings - Prospective study for total admission and missing case sheet was done between 21 March - 30 March 2024 |
||||||||||||||||||||||||||||||||||||
|
Distribution of type of admission & missing case sheets : |
||||||||||||||||||||||||||||||||||||
|
|
|
|
|
|
||
 |
|||||
 |
|
Total Admission, admission category, missing case sheet profile of the post strategy months on June, July, Aug 2003 |
|
|
S.No. |
|
Jun |
July |
Aug |
Total |
|
1 |
Adm. through OPD (A) |
1175 |
1405 |
1257 |
3837 |
|
2 |
Adm. through OPD (UA) |
03 |
NIL |
NIL |
03 |
|
3 |
Adm. through ERS |
356 |
384 |
478 |
1218 |
|
4 |
Direct Adm. to Ward |
NIL |
NIL |
NIL |
NIL |
|
5 |
Missing file |
43 |
26 |
115 |
184 |
|
Problem No.: 3 |
|||||
|
Excessive bed movement within the hospital Problems : |
|||||
|
ADVERSE EFFECTS : |
|||||
|
|||||
|
The administration wanted to have the first hand information as to why there is excessive bed movement with in the hospital. Some justified reasons such as serious patient with prolong illness can not be shifted, certain procedure such as ERCP where after the procedure the patient should not be moved etc. were taken into the account but still the administration was not satisfied. Doctors, nurses were ordered/requested to restrict the movement of beds within the hospital and use this facility only for needy patient but no improvement in the bed movement (decrease) was observed. After having interrogated more health care providers, it was observed that simply using the bed for any type of patient is the easiest task for Health Care Providers (HCP) therefore they would continue it. The SGPGI has a centralized internal transportation system (ICTS). The centralized station receives the demand from all patient care areas including OT, ICU, Investigation/procedure. Ultimately the hospital administration has to evolve the strategy for improving the situation. Based on above, a study was carried out with following objectives. |
|||||
|
Prospective study to confirm the problem and its magnitude was carried out between Nov. 2002 to 04 Jan 2024 |
|||||
|
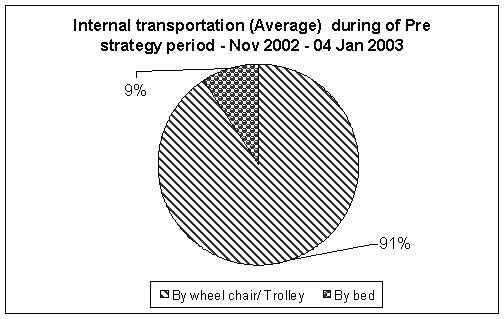
Pre strategy period - Nov 2002 to 04 Jan 2003 |
|||||
|
1. Month wise distribution of total bed movement |
|||||
|
Month |
Total internal Transportation movement (TITM) |
Bed movement |
% of bed movement |
|
November 2002 |
7624 |
650 |
8.5 |
|
December 2002 |
7631 |
750 |
9.8 |
|
Jan 1-4, 2003 |
1019 |
103 |
10.1 |
|
2. Internal transportation (Average) |
||
|
Mode |
Numbers |
Percentage |
|
By wheel chair/ Trolley |
14771 |
91.8 |
|
By bed |
1503 |
9.2 |
|
Total |
16274 |
100 |
|
|
|
|
Limiting factor - It was easy to order the internal transportation center and send the bed STRATEGY EVOLVED: |
|
|
Alternatives : |
|
|
a. Request to restrict the bed movement |
- No effect |
|
b. Office order to restrict the bed movement |
- No effect |
|
c. Introducing Bed Movement Requisition Form (BMRF) |
- Effective |
|
FORM BED MOVEMENT REQUISITION FORM (BMRF) |
|
|
1. Name of the Patient |
: --------------------------------------------- |
|
2. CR. NO. |
: --------------------------------------------- |
|
3. Ward and bed no. |
: --------------------------------------------- |
|
4. Diagnosis |
: --------------------------------------------- |
|
5. Reason for bed movement request |
: --------------------------------------------- |
|
6. Why not the patient can be moved by the stretcher/trolley. Please justify the reasons |
. ----------------------------------- |
|
Date: ---------------- |
Signature of S.R./Sister I/c
Name : |
|
|
|
|
Post strategy finding - |
|
|
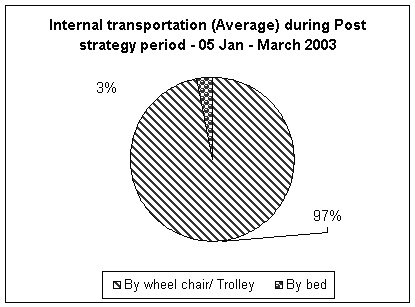
Post strategy period - 05 Jan to March 2003 |
|
|
After the implementation of BMRF, the prospective study was carried out again to find out the effect. |
|
|
1. Month wise distribution of total bed movement |
|
|
Month |
(TITM) |
Bed movement |
% of bed movement |
|
Onward 05 Jan 2024 |
6947 |
213 |
3.0 |
|
Feb 2003 |
7913 |
183 |
2.3 |
|
March 2003 |
8112 |
324 |
4.0 |
|
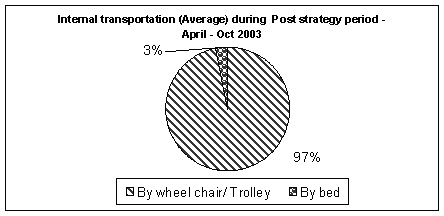
2. Internal transportation (Average) |
||
|
Mode |
Numbers |
Percentage |
|
By wheel chair/ Trolley |
22252 |
96.9 |
|
By bed |
720 |
3.1 |
|
Total |
22972 |
100 |
|
|
|
|
|
Post strategy period - April 2003 to Oct 2003 It was thought to withdraw the BMRF after 03 months of the implementation and observe the improvement even in absence of BMRF. Again a prospective study was carried out. |
|
1. After withdrawal of bed movement requisition form (BMRF) - Month wise distribution of total bed movement |
|
Month |
(TITM) |
Bed movement |
% of bed movement |
|
April 2003 |
7750 |
206 |
2.7 |
|
May 2003 |
8730 |
204 |
2.3 |
|
June 2003 |
7486 |
250 |
3.3 |
|
July 2003 |
8317 |
272 |
3.2 |
|
Aug 2003 |
8423 |
278 |
3.3 |
|
Sept 2003 |
8793 |
317 |
3.6 |
|
Oct 2003 |
8669 |
311 |
3.6 |
|
2. Internal transportation (Average) |
||
|
Mode |
Numbers |
Percentage |
|
By wheel chair/ Trolley |
56330 |
96.8 |
|
By bed |
1838 |
3.2 |
|
Total |
58168 |
100 |
|
|
|
|
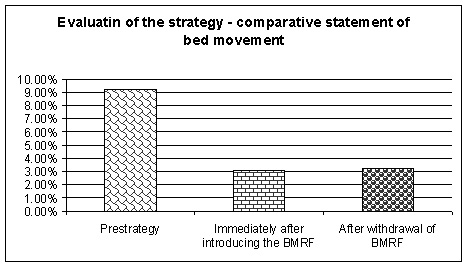
ACHIEVEMENT |
|
|
-
Pre strategy bed movement
|
= 9.2% |
|
-
Post strategy bed movement
|
= 3.2% |
|
- Net
improvement
|
= Approx. 65% |
|
|
|
Conclusion
–
|
|
|
These
three problems given as examples were ultimately solved by the
system approach with the help of effective Hospital Information
System and are still running well as being monitored regularly.
Problem solving process through system approach is the best
alternative for day today effective & efficient functioning.
Collection of data on every day basis, by forming an effective
information system (HIS) is the prerequisite for decision-making
process. Based on information received by processing the data
meaningfully, the system is implemented and monitored regularly.
Evaluation of post strategy results based on regular data collection
is absolutely necessary to make the difference. |
|